Dashboard
View all information at a glance.
Table of Contents
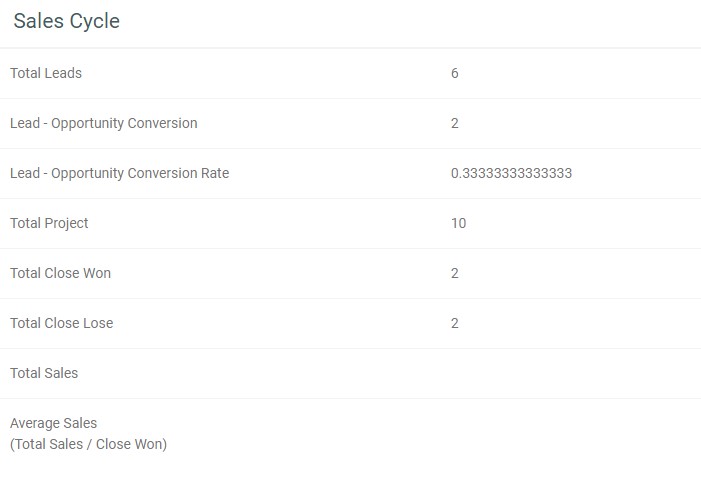
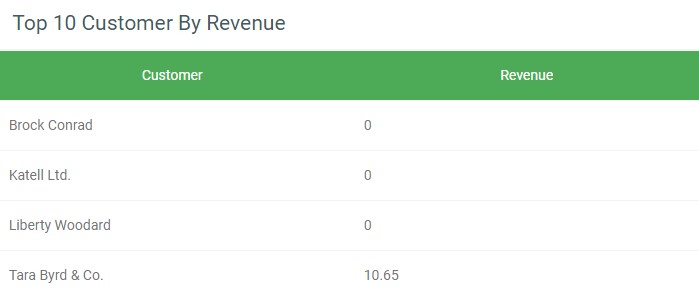
General Dashboard
You can view Sales Cycle and Top 10 Customer by Revenue in this dashboard.
Lead Dashboard
You can view each individual user and Total Lead Report.
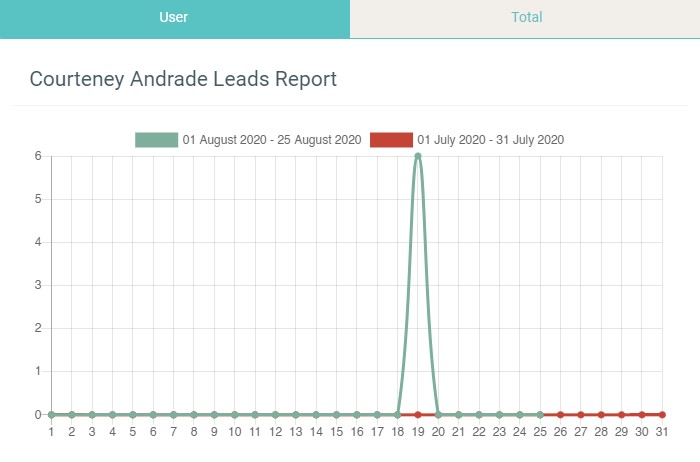
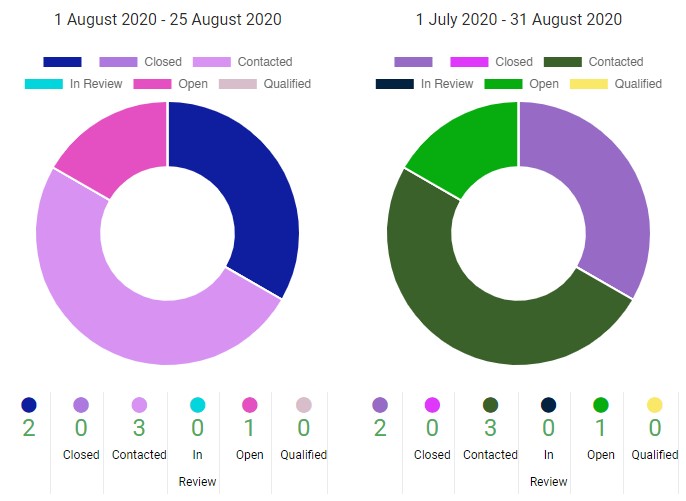
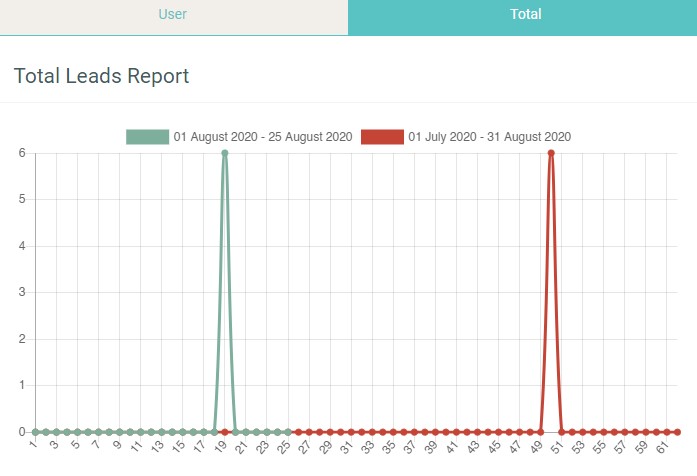 You also can view all lead by their status from both User Lead Report and Total Lead Report.
Project Dashboard
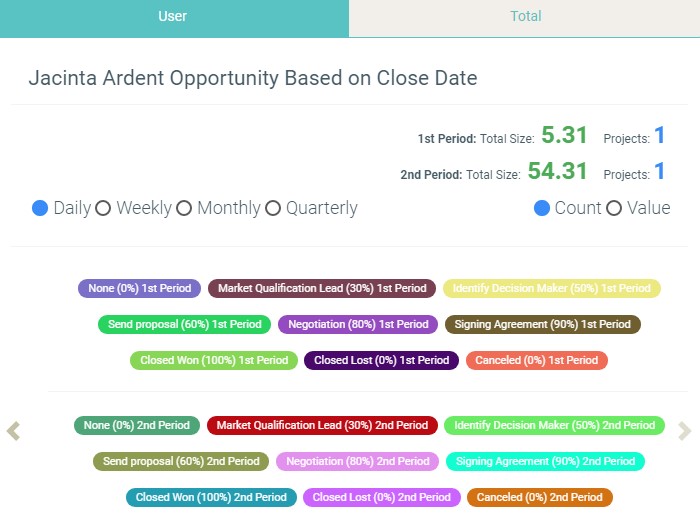
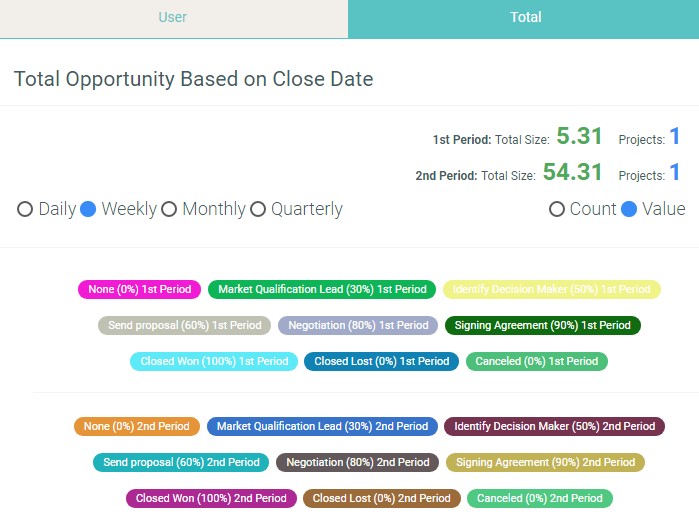
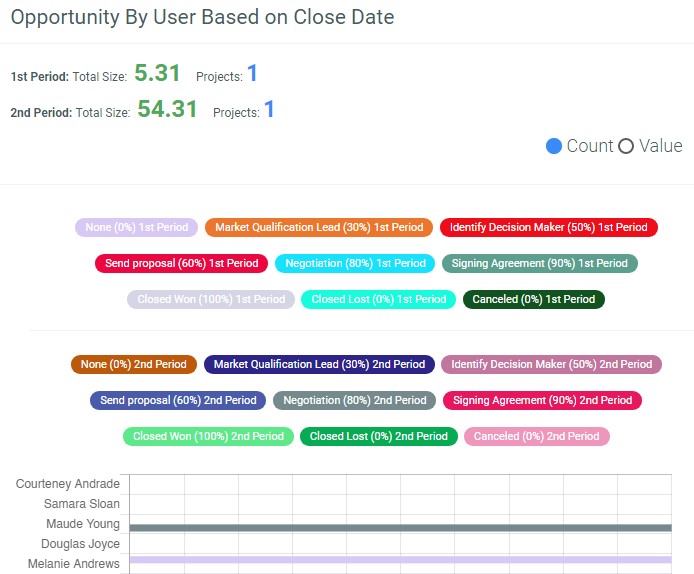
You can view each individual user and Total Opportunity Based on Close Date.
You also can filter it based on duration and by count or value.
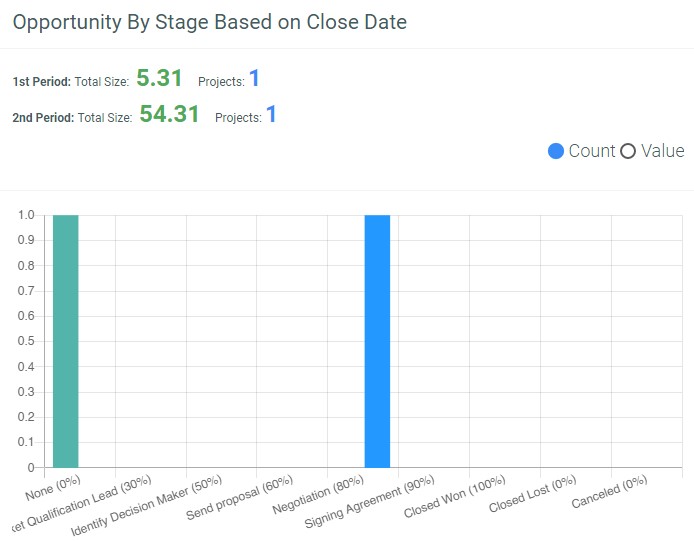
You can view Opportunity on Close Date by Stage and User.
You also can view it by count or value.
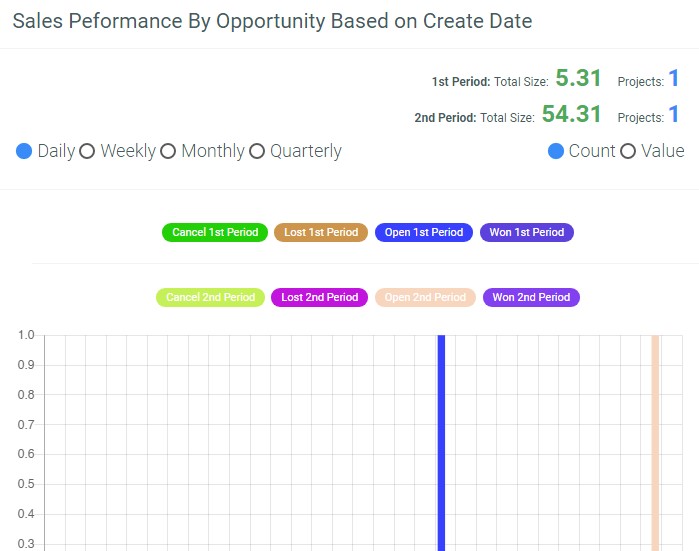
You can view Sales Performance by Opportunity by Create Date.
You also can filter it based on duration and by count or value.
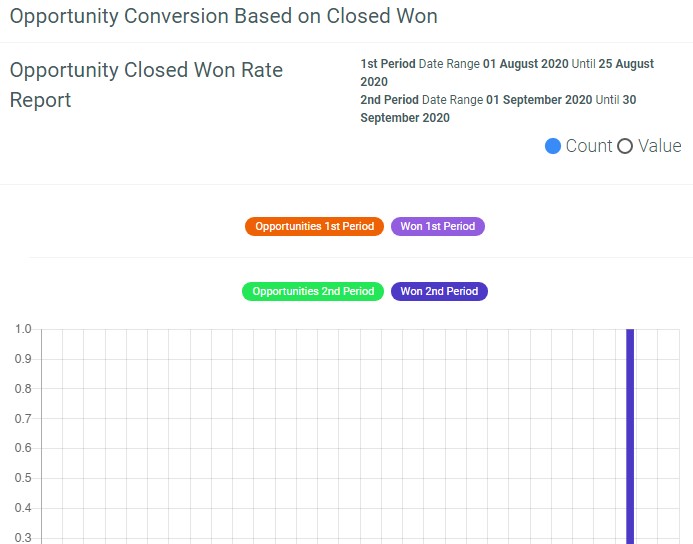
You can view Opportunity Conversion to Closed Won.
You also can view it by count or value.
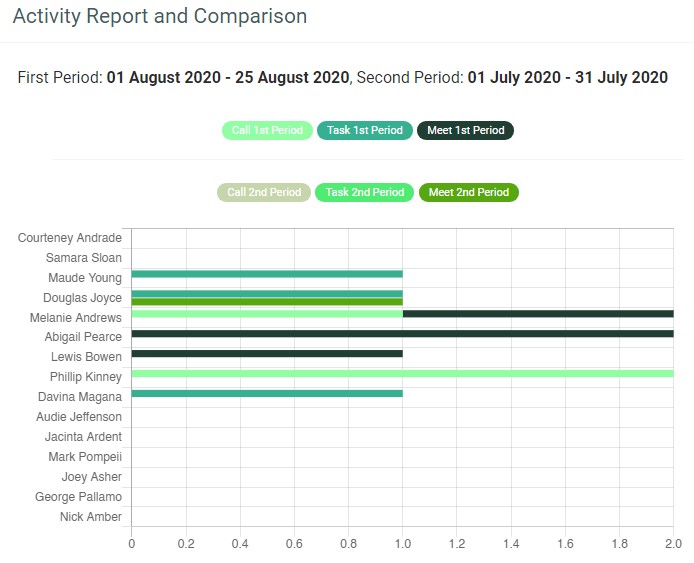
Activities Dashboard
You can view all user activity comparison on call, task, and meet in filtered period.
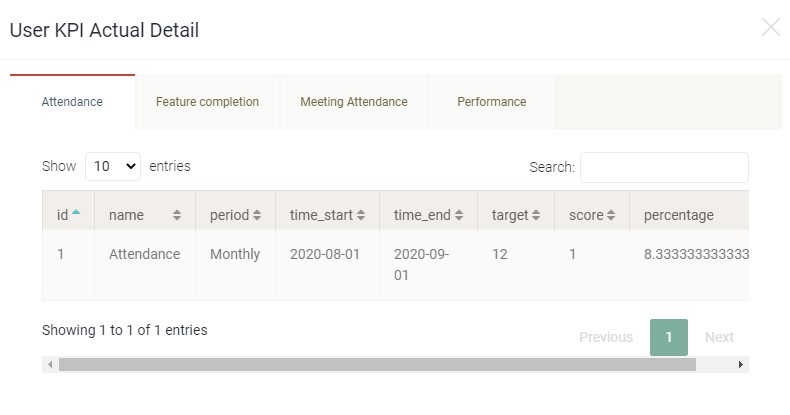
KPI Dashboard
You can view KPI set by user.
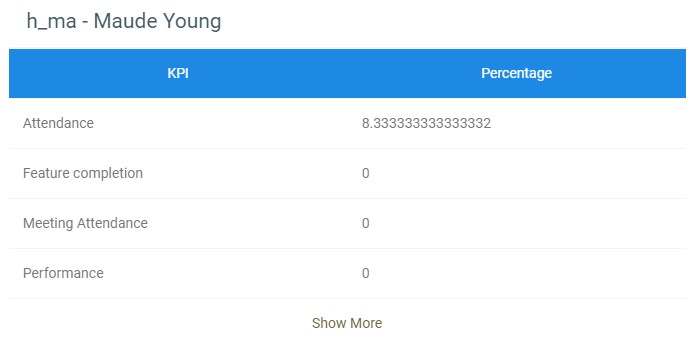 You also view more detail for each KPI by clicking Show More.